Notes and Graph
For this lab, we practiced being geologists. As pretending we're a team of geologists hired by BP, we used seismological data and our knowledge to find a location where our client could drill.
Part One
In Part 1, we looked at a graph of how fast different things go through at various densities. This goes as follows.
Speed of Sound
|
Density
|
We then used this data to make a graph. The graph shown below is the one we made. After this, we used this graph to determine the density at different speeds of sound.
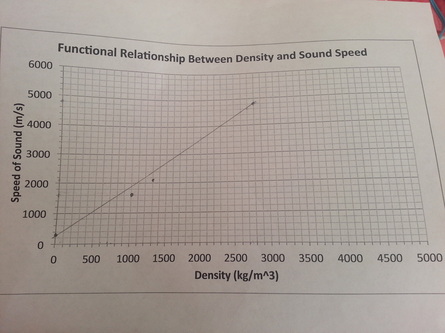
This is the graph for Part 1.
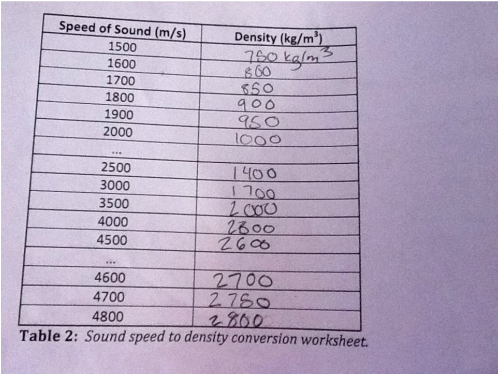
When we filled in the corresponding densities for the speed of sound.
Memorandum
To: BP Project Manager
From: Marybelle Panlilio
CC: Jennifer Ogo
Date: November 19th, 2013
Subject: Seismic Exploration Results/Findings
To get these results, I used pieces of paper, a pen, seismic data, measured speed, and density. I recommend you dig around C3 to D3, as the density is lower around that section. You need to drill around 1500 m. To get to the required location, you need to dig through A1 to E5 at 500m and 1000m, as well as A1 to C2 at 1500m. I hope you find oil.
Seismic Exploration Lab
Our materials in this lab was the oil field used in part 1, the map used in part 1, along with markers, a ruler, a chopstick, toothpicks, tape and reservoir volume and recovery rate cards.
In this lab, we have a $3 million drilling budget to find oil. We attached a drill bit (toothpick) to the drilling rig (chopstick). We then used our map to determine where we can find oil. There are budgetary rules for setting up the drill rig (deciding where to drill, -$225,000), for each cm drilled (-$100,000), for a broken drill bit and replacement (-$500,000) and for EPA infractions (if there is any fingerprints in the sand, -$500,000).
In this lab, we have a $3 million drilling budget to find oil. We attached a drill bit (toothpick) to the drilling rig (chopstick). We then used our map to determine where we can find oil. There are budgetary rules for setting up the drill rig (deciding where to drill, -$225,000), for each cm drilled (-$100,000), for a broken drill bit and replacement (-$500,000) and for EPA infractions (if there is any fingerprints in the sand, -$500,000).
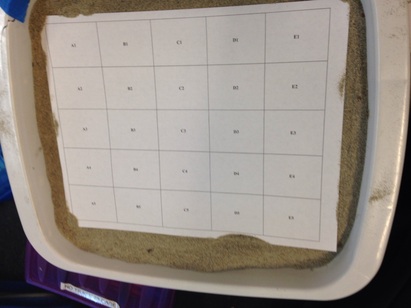
Our drilling field.
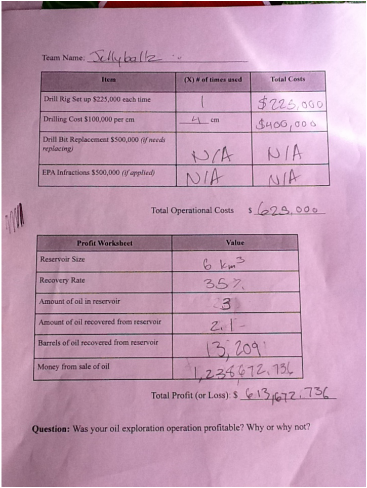
Our total costs.
Lab Questions
1. Did your oil exploration and recovery efforts make money? Discuss which variables would you want to change to make your business more profitable.
Our oil efforts weren't really successful. To make our business more profitable, I would need a better recovery rate to boost our money.
2. Complete the "T chart" below, to show which aspects of this simulation were realistic, and which aspects did not mimic reality.
Our oil efforts weren't really successful. To make our business more profitable, I would need a better recovery rate to boost our money.
2. Complete the "T chart" below, to show which aspects of this simulation were realistic, and which aspects did not mimic reality.
Realistic Variables
|
Unrealistic Variables
|
Our lab simulated how people in this profession find oil and how they determine how much they make or lose. However, instead of oil, we used syrup and a toothpick and chopstick to simulate a drill bit.
